Bitcoin ETF Inflows Surge Past 2B: Wall Street options frenzy exposes structural risk
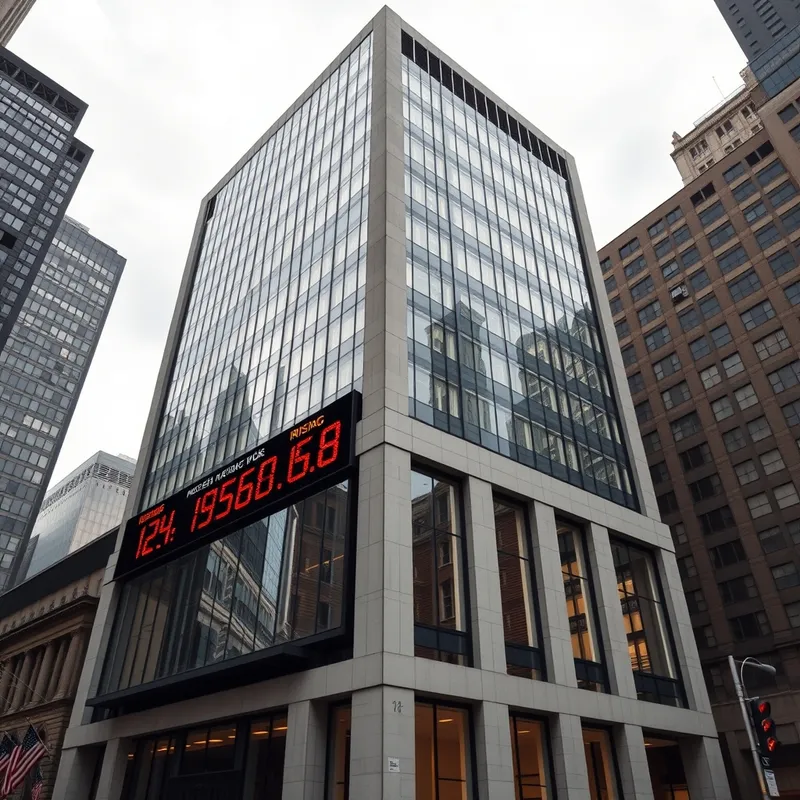
Wall Street's Derivatives Engine Re-Engages: The Structural Reality Behind the $100 Billion Asset Threshold
Institutional capital is no longer just buying spot exposure; it is weaponizing derivative options overlay strategies.

The sudden influx of institutional capital into regulated crypto vehicles has reached a critical inflection point, fundamentally altering market microstructure. Wall Street is no longer merely using spot exchange-traded products as passive holding pens for asset accumulation. Instead, complex institutional derivatives desks are using these products as the foundation for multi-layered leverage.
A continuous six-day buying run injected $337.6 million into US spot Bitcoin products recently, extending a multi-day streak to approximately $2.26 billion. This pushed monthly allocations to $2.72 billion—comfortably outpacing previous seasonal highs. However, stripping away the headlines reveals that a overwhelming majority of these inflows remain heavily concentrated in BlackRock’s iShares Bitcoin Trust (IBIT), which captured $208.9 million of that single-day figure alongside $1.33 billion over the preceding weekly stretch.
Fidelity’s FBTC managed $104.6 million in secondary absorption, but the broader asset management field continues to trail. While net flows for the year remain constrained by prior structural outflows of $2.57 billion, the sheer speed of asset expansion from $76.6 billion to $98.56 billion demonstrates how rapid price appreciation multiplies with fresh capital inflows.

📈 The Options Gamma Loop: How Wall Street Leveraged Spot Momentum
If this macro trend holds true, the immediate impact on trading dynamics extends far beyond simple share creation. The real story lies within the market microstructure, where trading volume across spot vehicles exploded to $22.1 billion in a single week—more than tripling prior base figures of $6.9 billion—accompanied by a single-day secondary turnover of $5.36 billion.

When investors buy call options, market makers sell those options and must continuously buy the underlying spot asset to remain risk-neutral. When options activity hits records, this dealer hedging loop acts like a financial turbine, artificially amplifying upward price movements regardless of broader macro trends.
This dynamic was fully displayed as IBIT call option volume expanded to an unprecedented 1.58 million contracts in a single trading session. Call volume maintained an elevated run above 1 million contracts across three consecutive days, driving a 0.05-point expansion in call skew—the sharpest three-day repricing of upside call volatility seen in over two years. Traded options volumes demonstrate that modern market participants are aggressively bidding up upside exposure via call options relative to downside puts.
"Leverage has shifted from off-shore margin desks to regulated options clearinghouses."
What the market is missing is that asset growth of nearly $22 billion over six sessions was driven primarily by underlying asset price gains rather than pure cash creation. As spot prices crossed $70,000 and broke above $80,000, existing ETF reserves automatically revalued higher. Fresh capital flows acted as a catalyst, but delta-hedging by options market makers provided the real mechanical force behind the move.
🏛️ The Portfolio Insurance Trap of 1987: Anatomy of Derivations Contagion
Given this macro tension, historical market structures reveal a clear warning about relying heavily on automated derivative strategies. During the period leading up to Black Monday in October 1987, institutional fund managers adopted institutional portfolio insurance strategies, utilizing computerized short S&P 500 futures trades to automatically hedge equity portfolios during dips.


When underlying equity markets met initial selling pressure, these algorithmic derivatives models triggered automated futures short selling, creating an unwinding cascade. The mechanics driving today’s ETF options market reflect a mirror image of this structure. Instead of downside portfolio insurance, institutions are engaging in dynamic upside chasing via call options contract books, forcing options dealers into aggressive programmatic spot buying as upside price thresholds are breached.
The uncomfortable reading of this setup is that dynamic hedging strategies work in both directions. If spot prices drop below key derivative support zones, options dealers will be forced to unwinding their long spot hedges just as aggressively. This sell-side feedback loop could quickly wipe out recent ETF asset gains, repeating structural patterns seen in legacy financial markets.
| Competing Force | The Irreconcilable Friction |
|---|---|
| 🌍 Spot ETF Aggregators vs. Options Market Makers | Concentrating underlying spot float to collateralize aggressive short-dated upside derivative plays. |
| 🏛️ BlackRock IBIT Dominance vs. Secondary Fund Liquidity | 🌍 Divergent liquidity profiles creating systemic reliance on single-issuer option market clearing depth. |
| 🏢 Institutional Delta Hedging vs. Organic Spot Accumulation | Replacing long-term structural buying with transient, highly volatile dealer rebalancing obligations. |
🔮 Derivatives Volatility and the Push Past $100 Billion
Looking ahead, the interaction between spot ETF products and regulated derivatives desks will dictate price volatility into late 2026. The financial ecosystem is fast approaching the historic $100 billion total asset mark, standing roughly $1.44 billion away from reclaiming the high-water benchmarks established earlier in the year. Crossing this psychological threshold will likely trigger a fresh wave of corporate treasury allocation and FOMO buying from traditional funds.
However, institutional investors should carefully distinguish between organic asset creation and leverage-driven price appreciation. The high market concentration within a single fund—where one manager captures over 60% of daily inflows—creates a single point of structural reliance. Should option market volatility drop sharply, market makers may reduce their spot hedges, triggering rapid price pullbacks even while net fund flows remain positive.
Regulatory scrutiny around institutional derivatives overlay strategies is also expected to intensify. As options volume on spot crypto products approaches equity-market levels, regulatory agencies are likely to re-examine margin requirements and capital rules for option market makers. This dynamic could cap derivative leverage, forcing the market back toward traditional spot demand fundamentals.

The expansion of crypto ETF options marks a fundamental evolution in how institutional capital impacts asset prices. Market rallies will be increasingly amplified by programmatic dealer options hedging rather than pure cash inflows alone. Traditional traders who fail to track call options open interest and dealer gamma positioning risk getting caught on the wrong side of sharp liquidity squeezes.
⚡ Call Skew: The pricing discrepancy between out-of-the-money call options and put options, reflecting market demand for upside exposure relative to downside protection.
🔄 Delta Hedging: A risk management strategy used by options market makers where underlying spot assets are systematically bought or sold to offset direction risk from open derivative contracts.
- If net weekly ETF creation flows fall below $200M alongside declining options volume → market structure signals a transition to consolidation.
- If single-day IBIT call options contract volume falls below 400,000 → dealer gamma squeezing capacity decreases, slowing upward price velocity.
- If aggregate spot ETF assets surpass $100B while cumulative yearly flows remain net negative → upside price gains reflect asset repricing rather than new capital.
— John Maynard Keynes
This analysis is synthesized from aggregated market data and institutional research insights. It is provided for informational purposes only and should not be construed as financial advice. Cryptocurrency investments carry high risk; please conduct your own due diligence before making any investment decisions.
Related Intelligence

Strive Bitcoin Buying Escalates Risk: Underwater Bets Test Capital

Debasement Trade Drives Bitcoin Surge: Jackson Hole Pivot Risk

AI Capital Exit Ignites Bitcoin Rally: Macro Debt Drives Flight to BTC

Bitcoin Breakout Masks Long Trap Risk: Funding Rates Reach Peak

SpaceX Faces Massive AI Capital Burn: A 1.2 Billion Dollar Drag