Selective pumps mask market exodus: The 240 billion exit trap
The Selective Pump Illusion: Why Micro-Rallies Mask a $240 Billion Altcoin Liquidity Drain
The most violent altcoin rallies of 2026 are merely funded by their own funerals.
Today, selected crypto assets are printing staggering isolated gains. Worldcoin (WLD) has surged 149.6% over the past month, Stellar (XLM) climbed 54%, Jito (JTO) posted a 46.7% rise, and Hyperliquid (HYPE) touched a record high of $77 on June 16, fueled by almost $1 billion in daily trading volume and a massive $9 billion in open interest. Over a shorter seven-day span, the momentum extended as JTO added 42.5%, Aerodrome (AERO) surged 36.8%, and WLD advanced another 33%, while legacy assets like Uniswap (UNI) and Aave (AAVE) posted double-digit gains.

Yet, this flash of green is a mirage. Broader altcoin dominance (excluding Bitcoin, Ethereum, and stablecoins) has slipped from 21.41% to 21.16% over the same 30-day period, collapsing from its 23.55% year-to-date starting level. Behind this decline is a massive shift: Bitcoin dominance has dropped from 58.16% to 56.96%, but instead of rotating into altcoins, this freed share was entirely swallowed by stablecoins, whose market share rose from 10.79% to 12.53%. More alarming is the structural selling: CryptoQuant data reveals that altcoins have logged 15 consecutive months of net spot selling, resulting in a cumulative buy-versus-sell volume deficit of $240 billion—the deepest negative reading since records began in 2020.
🔍 The Structural Architecture of a Microstructure Trap
When a crypto asset experiences a sudden, intense price spike on low overall market volume, it usually means buy orders are hitting a thin wall of sellers, not that a broad bull market has begun.
The pattern suggests that the market is starved for organic fiat inflows. Consequently, we are witnessing a cannibalistic game of liquidity rotation. Capital does not enter the ecosystem; it merely migrates to whichever token currently boasts a compelling, isolated catalyst. Whether it is the AI-adjacent treasury disclosures of a micro-cap proxy, the surging real-world asset figures backed by institutional tokenization networks, or the decentralized derivatives platform processing massive nominal volumes, these catalysts are acting as local gravity wells. They pull capital from weaker altcoins, creating localized bubbles of appreciation while the broader index silently bleeds out.
Strip away the noise and what this signals is a highly sophisticated game of hot potato. Market makers and institutional entities are utilizing these concentrated spikes to unwind heavy spot positions, finding eager retail buyers who mistake localized volatility for the dawn of a new expansionary cycle. This selective bidding keeps the headline figures attractive, hiding the quiet but continuous liquidation of the rest of the cohort.
"In a capital-starved regime, a localized pump is not a sign of life; it is an exit portal."
🏛️ The Macro Draft and the Rise of Risk-Free Yield
Given this internal liquidity cannibalization, the macroeconomic environment explains why capital is fleeing the broader asset class altogether rather than rotating.
When the Federal Reserve keeps interest rates high, investors can earn a safe return on government bonds, making risky digital assets far less attractive.
The macroeconomic framework has undergone a major hawkish recalibration. With a significant portion of central bank policymakers now actively contemplating an interest rate hike in the near term, and the policy rate locked in an elevated band alongside rising inflation expectations, the hurdles for risk assets have become exceptionally steep. High-beta assets cannot easily compete with high risk-free yields.
What this signals is a quiet but persistent capital flight. Investors are systematically shifting their allocations out of digital assets and into traditional semiconductor and artificial intelligence equity funds, which are capturing the lion's share of global liquidity. The outflows observed in major exchange-traded funds of the leading digital asset reflect a broader defensive reallocation. When the largest, most liquid crypto asset is losing its institutional bid to legacy tech ETFs, the tail-end altcoins have virtually no chance of sustaining organic upward momentum.
📊 The Mechanics of 1973 Institutional Concentration
The structural dynamics of this localized capital concentration closely mirror past inflection points in traditional financial history.
This dynamic is structurally identical to the infamous "Nifty Fifty" era of 1973 in traditional equity markets. During that period, institutional managers faced high inflation and tightening monetary conditions. Rather than exiting the market entirely, they concentrated their capital into a narrow group of high-growth, blue-chip stocks—such as Polaroid, Xerox, and Avon—believing these companies could withstand any economic downturn. The selective bid created an illusion of market health that masked systemic weakness.
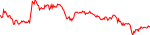
In my view, today's selective pumps are the direct descendants of that concentration mechanism. When macro pressures finally overwhelmed the system in the mid-seventies, those isolated giants collapsed in a delayed, highly violent capitulation. Today, the concentration of liquidity into select high-performance protocols is driven by the exact same mechanism: institutional managers and retail traders alike are crowding into safe-haven tokens with distinct narrative shields, completely blind to the fact that the underlying foundation is being eroded by a multi-month spot selling campaign.
| Competing Force | The Irreconcilable Friction |
|---|---|
| 🏛️ Institutional Liquidity Providers vs. Narrative-Chasing Retail | Farming localized pumps to unload legacy spot bags. |
| Hawkish Sovereign Policy vs. On-Chain Yield Seekers | Sovereign yields devalue high-beta utility asset premiums. |
| Stablecoin Stagnation vs. Protocol Valuation Expansion | Withdrawing capital to cash instead of redeploying risk. |
🔮 The High-Beta Liquidity Divergence
Following this structural pattern, the path forward for the digital asset landscape depends on a vital shift in on-chain capital dynamics.
If the structural sell-off remains unabated, the market is poised to split into a permanent multi-tier system. The base case points to a prolonged consolidation where the broader sector's dominance remains depressed. Under this regime, the overall market index will continue to feel heavy, as any minor recovery is immediately met by spot distribution from early venture allocations and distressed sellers.
Conversely, a true structural reversal requires more than just localized hype; it demands a sustained contraction in stablecoin dominance and a multi-week reversal in cumulative spot volume trends. Without these systemic confirmations, investors must treat every sudden breakout not as the beginning of a broad sector rally, but as a potential liquidity trap. The market has reached a critical structural junction where token utility and real revenue are no longer optional luxuries—they are the only mechanisms capable of preventing a total valuation collapse.
"When stablecoins act as an exit ramp rather than a launchpad, the bull market is a mathematical impossibility."
Just as the Nifty Fifty concentration marked the absolute late-stage peak of the 1970s distribution phase, the isolated pumps in current network champions signal a highly sophisticated liquidity extraction regime. The market is witnessing an elite flight to quality where only assets with tangible protocol fees or institutional integrations can sustain interest, while zombie assets are quietly liquidated. This means a generalized rally is highly unlikely to materialize under current macro conditions.
In my view, the smart money is not rotating; it is withdrawing. The massive multi-billion spot deficit indicates that early-stage investors and venture funds are systematically dumping unlocked supply into any brief pocket of retail demand. Until this overarching selling trend reverses, the broader index is likely to bleed toward lower dominance levels.
⚖️ Net Spot Selling: The net difference between market buy orders and market sell orders executed on spot exchanges. A deeply negative figure indicates systematic distribution by large-scale market participants.
⚖️ Others Dominance: The total market capitalization of all cryptocurrencies, excluding Bitcoin, Ethereum, and stablecoins. It serves as the cleanest metric for evaluating the overall health of the speculative altcoin market.
⚖️ Yield-Based Allocation: The process of reallocating capital from high-risk speculative protocols to low-risk sovereign assets when central bank policies offer attractive risk-free returns.
- If the broader altcoin dominance index falls below the critical 20.5% threshold → this triggers a systemic migration toward defensive cash positions.
- If the cumulative spot volume deficit fails to contract for four consecutive weeks → capital allocation should favor highly liquid sovereign yields.
- If tokenized real-world assets on public networks drop below current growth projections → the fundamental valuation of underlying infrastructure must be downgraded.