Solana Price Dips Amid Institutional: Liquidity Drain vs. On-Chain Surge
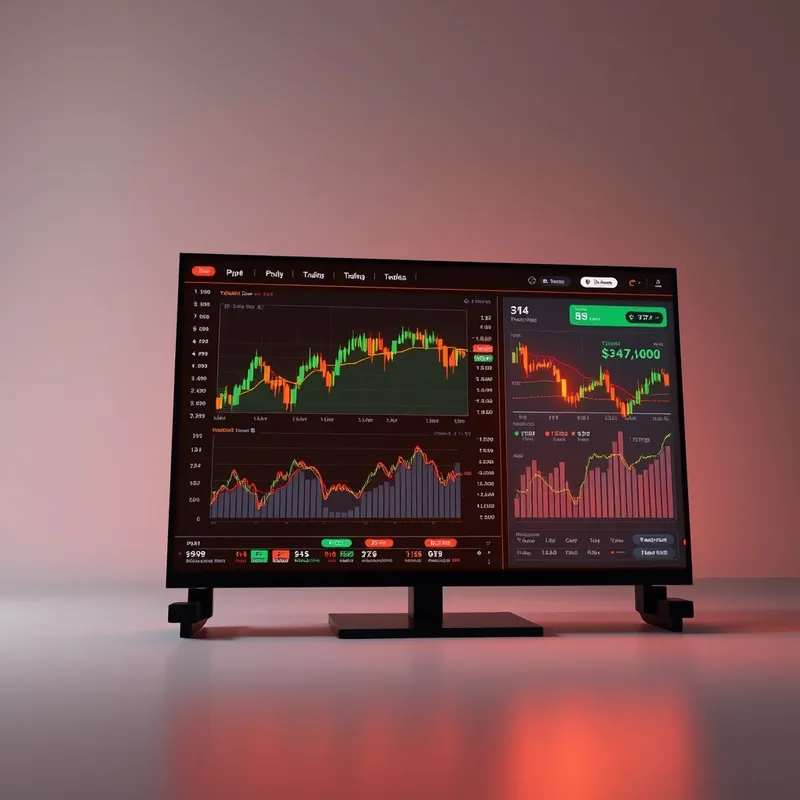
Solana Liquidity Bifurcation: ETF Outflows Collide With Tokenization Boom
Wall Street is liquidating its Solana exposure while deploying billions into its network rails.

Solana (SOL) is navigating a violent macro decoupling, trading near $106 after absorbing an approximate 15% retracement from its late-September high. While secondary market investors rapidly exit spot vehicle wrappers, the underlying ledger is absorbing unprecedented institutional integration.

This structural friction creates an uncommon divergence: derivative and exchange products are experiencing severe liquidity extraction, even as real-world asset capitalization cements the protocol as a premier settlement layer.
📉 The Daily Breakdown Threatening Lower Valuation Shelves
On-chain liquidity behaves much like an electrical grid: when total transmission volume drops, high-voltage substations are the first to short out. The daily technical profile indicates that the broader structural uptrend of higher highs is buckling under distribution pressure.
Sellers capped the late-September peak near $125 after aggressively defending overhead resistance, following an initial August shoulder formation around $111. The current configuration exhibits the classic markers of a bearish head-and-shoulders formation, where the right shoulder threatens to finalize near the 0.618 Fibonacci level around $115.
Contracting spot volume across major centralized venues confirms exhaustion among dip buyers. The Relative Strength Index trades defensively at 44, signaling that brief upside bounces represent corrective retests rather than renewed accumulation regimes.

"Utility expansion cannot immediately backstop a synchronized withdrawal of regulated exchange liquidity."
🏛️ The Institutional Capital Run: Spot Wrapper Capitulation
Tracking product-level flows exposes precisely where structural supply is being dumped. Prior upward momentum in late August and late September was heavily fueled by institutional appetite, with US spot SOL ETF inflows exceeding 200,000 SOL per day on a 7-day rolling basis.
That dynamic has entirely inverted. Regulated investment vehicles have transitioned into relentless supply faucets, with net redemptions descending to approximately minus 40,000 SOL daily—marking an annualized outflow run-rate that represents the deepest deficit recorded throughout 2026.
This institutional evacuation drains approximately $4.2 million from exchange order books on a daily cadence. The rapid unwind reflects defensive risk adjustments from macro discretionary allocators reacting to broader rate uncertainty.
🌐 The Tokenization Paradox: Wall Street Stays On-Chain
If capital flight through ETFs represents one half of the equation, direct network deployment represents the counterweight. Tokenized real-world assets (RWA) deployed on the network, strictly excluding fiat-backed stablecoins, command roughly $4.4 billion in total value.
This footprint has surged by roughly 100% since early May, preserving peak levels despite the broader pricing drawdown. Global asset management heavyweights BlackRock and State Street are actively executing deployments on the ledger, establishing persistent enterprise balance-sheet operations.

Concurrently, retail participation via regulated proxies is broadening, with roughly 1.4 million unique addresses holding tokenized equities directly on-chain. Crucially, because these corporate credits and equity shares are denominated in US dollars, they reflect massive protocol consumption without generating direct buying momentum for the underlying utility token.
"Enterprise rails are thriving precisely because they ignore the secondary market token price."
📜 The 1999 Telecom Fiber Trap: Mechanism Over Hype
In 1999, telecommunications providers laid millions of miles of dark fiber optic cables across North America, spending billions on infrastructure that revolutionized global internet bandwidth. Yet, the equity shares and financing debt instruments behind those networks collapsed by over 90% when immediate cash-flow yields failed to service the speculative boom.
The mechanism at play was clear: infrastructure buildout creates permanent utility, but until monetization protocols convert throughput into equity value, speculative asset holders bear the financing burden. In my view, the current tokenization boom on Layer-1 ledgers mirrors this identical phenomenon. The network is winning enterprise adoption, but token design mechanics do not automatically capture RWA issuance value.
While traditional asset managers leverage ultra-low latency settlement rails for dollar-denominated balances, spot token holders absorb the selling pressure of ETF liquidation cycles. The infrastructure will endure, but speculative value must recalibrate to actual economic capture.
| Competing Force | The Irreconcilable Friction |
|---|---|
| Spot ETF Redemptions vs Balance-Sheet Issuers | 💰 Liquidating market wrapper exposure while consuming underlying rail infrastructure cheaply. |
| Dollar-Denominated RWAs vs Base-Asset Economics | 🏢 Growing institutional ledger throughput without driving structural buying pressure into SOL. |
| Alpenglow Infrastructure Upgrades vs Risk-Off Macro Desks | ⚖️ Deploying sub-second finality while macro desks prioritize defensive liquidity preservation. |
⚡ Protocol Maturation: Throughput Upgrades vs Range Defenses
Building on this structural tension, the immediate technical trend hinges on clear psychological and on-chain boundaries. A confirmed daily close below the critical neckline threshold around the century mark invalidates the higher-low thesis, opening a direct trajectory down toward the technical measured target, roughly twenty-five percent beneath prevailing market bids.

Conversely, multi-timeframe weekly structures preserve an alternate configuration: a high-timeframe cup-and-handle pattern that requires reclaiming the overhead resistance corridor. Validating that bullish resolution would project an advance toward the higher multi-month bands, effectively dismantling the intermediate distribution structure.
Execution roadmaps introduce a major catalyst: the deployment of the Alpenglow architecture upgrade. By cutting transaction settlement finality down to an expected range of sub-200 milliseconds, developers are seeking to neutralize latency risk precisely as Wall Street deepens its tokenized securities footprint.
The divergence between spot derivatives and network utility marks the end of speculative beta driving base-layer valuations. Future protocol outperformance will require capturing direct fee yield from institutional debt issuance rather than passive retail trading volume.
If technical support falters under sustained wrapper redemptions, infrastructure value will reset before genuine enterprise settlement fees can permanently anchor market capitalization.
- If ETF net redemptions persist above negative forty thousand units daily → shifts trading bias into defensive distribution.
- If the ledger closes below the critical psychological support shelf → downshifts medium-term exposure to lower liquidity pools.
- If real-world asset capitalization decouples below current levels post-upgrade → signals broader institutional deployment abandonment.
⚖️ Real-World Assets (RWA): Tangible financial instruments, including US Treasuries, commercial paper, and equities, digitized as smart contracts to clear on public ledgers.
⚡ Transaction Finality: The operational duration required for a cryptographic network block to become irreversible and permanently recorded.
— — coin24.news Editorial
This analysis is synthesized from aggregated market data and institutional research insights. It is provided for informational purposes only and should not be construed as financial advice. Cryptocurrency investments carry high risk; please conduct your own due diligence before making any investment decisions.
Related Intelligence

Sectora Token Signals Liquidity Trap: The Microcap Illusion

Sui Network Scales Financial Rails: Institutional Integration vs Execution Reality

Zoomex Exchange Subsidizes Trading: The Liquidity Illusion

MoneyGram Validates XDC Network: Governance Theater Before Real Capital Flow

XRP Whale Exodus Exposes Liquidity: Institutional Liquidity Illusion