Solana Staking Holds 69 Percent Base: Supply Lockup Defies Fear

Solana’s 69% Staking Fortress Collides With Macro Capitulation
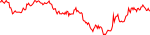
SOL dropped to $67.37 as 68.14% of its supply remained locked in staking.


That divergence defines the current market structure. While spot prices tumbled roughly 6.8% in 24 hours to trade near $70—marking a decline of more than 20% since early November—the underlying network security and holder conviction have barely flinched. As of Nov. 8, approximately 434.15 million SOL remained staked with voting validators, creating a stark disconnect between paper-market liquidation and on-chain commitment.
🌊 The Macro Liquidity Squeeze Behind the Sell-Off
To understand why a network with near-record staking participation is bleeding out on the spot charts, you have to look at how macro rate expectations dictate crypto order books. When sovereign bond yields threaten to stay elevated, institutional desks systematically de-risk high-beta assets regardless of their on-chain fundamentals.
The current downturn is not an isolated protocol failure; it is a broader liquidity contraction. Federal Reserve Governor Christopher Waller’s recent support for a December rate hike pushed CME FedWatch probabilities to 96.3%, instantly draining risk appetite across digital assets. With the broader crypto Fear and Greed Index sinking to 13 and Bitcoin slipping below $70,000, capital is rotating out of risk assets at an aggressive clip.
Institutional vehicles are amplifying this pressure. US spot Solana ETFs have logged seven consecutive sessions of outflows, with $58.3 million exiting the products—a sharp reversal from the $1.16 billion in cumulative inflows seen earlier in the year. Meanwhile, roughly $67 million in leveraged long positions were liquidated as key support gave way, creating a mechanical cascade of forced selling into thin weekend order books.

"Price is currently a function of leverage unwinds, not network abandonment."
🔒 Supply Lockup vs. Spot Market Fragility
If macro headwinds are dictating the sell-off, the internal mechanics of Solana’s staking architecture explain why the floor has not completely collapsed. Staking on Solana operates as a native yield-bearing mechanism where token holders delegate their assets to validators to secure the consensus layer in exchange for inflationary rewards.
The data points to a structural supply shock that the spot market is temporarily ignoring. Ending the third quarter with roughly 69% of its supply staked, Solana leads major smart-contract networks in capital commitment—more than double Ethereum’s comparable staking ratio. Earning a gross yield of roughly 5.2%, or close to 5% net of validator commissions, has turned staking into the default state for SOL holders rather than an active trading strategy.
Even during this 30-day drawdown, only around 4.8 million SOL exited active staking. Here is what everyone is ignoring: when nearly two-thirds of a network's supply is locked up, the remaining liquid float becomes hypersensitive to marginal shifts in demand. A thin liquid float cuts both ways—it accelerates downside wicks during ETF outflows, but it also starves sellers of ammunition once forced liquidations clear.
In my view, this dynamic creates a glaring tension between short-term speculators and long-term validators. Validators and native stakers are content to compound yield and absorb the volatility, while ETF allocators and perpetual futures traders are fighting over a shrinking pool of liquid tokens.

⚙️ Protocol Velocity and the Breakpoint Catalyst
Given this tension between macro-driven selling and structural supply lockup, the timing of Solana’s flagship Breakpoint conference in London—drawing over 8,000 attendees from Nov. 15 to 17—serves as a critical litmus test for ecosystem momentum. Historically, major developer conferences act as narrative resets, though price reactions remain notoriously inconsistent.
| Metric / Event | Current / Historical Figure | Market Significance |
|---|---|---|
| Active Staking Ratio | 68.14% (434.15M SOL) | Limits available spot supply during panics |
| US Spot ETF Flows (7-Day) | -$58.3 Million | 🏛️ Signals short-term institutional de-risking |
| Long Liquidations | ~$67 Million | Mechanical driver of the overnight wick |
| Alpenglow Finality | ⚖️ ~150 Milliseconds | Core infrastructure upgrade supporting AI/DeFi |
Under the hood, technical execution has not slowed down to match the price action. Following October’s Alpenglow upgrade, which compressed transaction finality to roughly 150 milliseconds, the ecosystem is pushing into encrypted computation. Arcium’s recent launch of Blackthorn—a private AI inference stack running encrypted prompts, outputs, and model weights—demonstrates that capital and developer talent are still building for high-throughput institutional use cases, including on-chain capital markets and AI agents.
Let’s be honest: developer milestones rarely rescue a token from a Federal Reserve rate-hike scare overnight. Past Breakpoint events prove this ambivalence; while the 2023 Amsterdam conference sparked a 20% rally, last year’s Abu Dhabi gathering saw the token slip 2.3% before staging a recovery over the subsequent month.
🎯 Technical Thresholds and the Liquidity Battlefield
If historical precedent holds true, the immediate battleground shifts to pure market microstructure and key technical levels. The overnight low just above $67 represents the primary line in the sand; holding this threshold suggests that leveraged sellers are finally exhausting their inventory.
For bulls to regain structural control, the market must first reclaim the August support zone near $72, followed by the $75 to $80 range lost during the recent breakdown. A decisive push above that upper boundary would return the asset to its prior consolidation channel, putting the 200-day moving average just under $89 back into play as a definitive trend-reversal target.

Conversely, the uncomfortable reading of this chart is that a failure to hold the $67 floor opens a direct air pocket down to the psychological $60 level. Until US spot ETFs stem their daily bleeding and macro rate expectations stabilize, spot price will remain a hostage to traditional finance liquidity flows rather than on-chain fundamentals.
The current market dynamics suggest that Solana’s staking base is acting as a structural shock absorber rather than a price floor. Once macro rate expectations are fully priced into risk assets, the combination of a compressed liquid float and 150-millisecond finality positions the network for an asymmetric rebound.
However, timing that inflection point requires watching institutional ETF flows rather than conference headlines. Until traditional capital stops exiting through the ETF wrapper, spot rallies will likely face heavy overhead resistance.
⚖️ Liquid Float: The portion of a cryptocurrency's total supply that is actively available for trading on exchanges, excluding tokens locked in staking or long-term vesting contracts.
⚡ Transaction Finality: The exact time required for a blockchain transaction to become irreversible and permanently recorded on the ledger.
- If US spot Solana ETFs post three consecutive sessions of net inflows → this signals institutional de-risking has concluded.
- If active staking participation drops below 65% of total supply → this indicates core validators are beginning to capitulate.
- If spot price closes below the $67 overnight low on high volume → the probability of a $60 retest rises sharply.
— Warren Buffett
This analysis is synthesized from aggregated market data and institutional research insights. It is provided for informational purposes only and should not be construed as financial advice. Cryptocurrency investments carry high risk; please conduct your own due diligence before making any investment decisions.
Related Intelligence

Zoomex Masks Trading Risk With Hype: The Proof of Reserve Facade

Bitrue Teaser Masks Marketing Trap: Retail Hype Machine

China Is Running Low on Copper. So Why Are Prices Falling?

Gate Captures Elysium Liquidity Flow: Defensive CEX Expansion

Tesla SpaceX Merger Unites 30221 BTC: Zero Net Buy Pressure