Solana traders face massive squeeze: funding masks flat spot demand
The $1.8 Billion Synthetic Mirage: Why Solana’s Leverage Surge Signals Structural Fragility
Speculators are paying peak bull market holding fees for an asset sitting sixty percent off its high.

Perpetual futures open interest on Solana has reached roughly $1.8 billion across 23.1 million SOL in notional exposure, pushing aggregated funding rates across Binance, Bybit, Hyperliquid, and OKX to their highest levels since September 2025. With positive funding rates holding around 0.01% every eight hours, leveraged long traders are paying shorts a steep daily premium to defend spot prices trading in the upper-$70s.
When funding rates last reached this extreme in late 2025, the token traded above $200. Today, traders are paying similar carry costs to keep price action tethered near immediate technical resistance at $80, creating a critical tension between speculative futures exposure and underlying spot market absorption.
📊 The Derivative Disconnect: Carrying Costs vs Spot Velocity
Following this surge in derivative exposure, market participants face a stark structural divergence between offshore futures positioning and real network usage. Positive funding rates represent a relentless recurring cost for long traders, creating a timer on leveraged bets that requires continuous spot price appreciation to remain sustainable.
Derivative markets rely on spot liquidity to absorb selling pressure during position adjustments. When futures leverage expands into flat or declining on-chain trading volumes, the risk of a market mismatch increases dramatically across central venues.
"Leverage can manufacture temporary price floors, but only organic spot demand can build permanent ceilings."
In market microstructure, carrying cost acts as the fee paid to keep leveraged contracts tied to physical prices. Holding massive speculative exposure without spot confirmation is like keeping a high-performance engine idling at maximum revs while sitting in neutral; energy burns rapidly without generating forward momentum.
On-chain DEX activity and decentralized perpetual volumes have slowed over recent cycles. While overall address activity remains high, the net capital injected into ecosystem stablecoin reserves remains below previous structural peaks, leaving the current rally reliant on offshore derivatives leverage rather than genuine fiat inflows.
📉 Yield Illusions and the Institutional Capital Gap
Building on this divergence in market mechanics, fundamental protocol metrics reveal an uncomfortable truth regarding network value capture. Protocol throughput remains strong, but real transaction revenue captured by the network has compressed sharply as blockspace costs dropped.
A substantial majority of the native staking yield paid to network validators is derived from token issuance rather than organic transaction fees paid by active users. This issuance-heavy reward structure dilutes non-staking token holders over time, masking soft fee generation under the banner of high nominal yields.
Institutional exposure through spot investment vehicles reflects this broader hesitancy. Cumulative institutional flows into dedicated altcoin funds represent a minor fraction of overall market capitalization when measured against Bitcoin's institutional footprint, indicating that traditional asset managers are treating current price levels with tactical skepticism.
🏛️ The 2011 Commodity Futures Carrying Trap
To evaluate the structural danger of paying extreme carry costs into flat spot demand, institutional investors must examine historical derivative dislocations. During the silver futures market expansion of 2011, speculative paper demand drove futures open interest to extreme highs, forcing leveraged long holders to pay substantial carrying fees into a widening contango market structure.
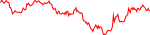
Paper futures demand completely detached from physical spot buying during that cycle. Once margin requirements were adjusted and long positions realized physical buyers would not step in at elevated valuations, the resulting unwind triggered a violent price collapse as carrying costs forced systematic liquidation.
"When carry costs outpace protocol value capture, paper conviction inevitably collapses into physical market reality."
The pattern suggests that today's perpetual futures environment reflects a similar carry friction. What retail market participants interpret as institutional accumulation appears to be an aggressive front-running strategy by leveraged funds attempting to force a breakout above key technical resistance levels.
| Competing Force | The Irreconcilable Friction |
|---|---|
| CEX Leveraged Longs vs On-Chain Spot Demand | 💱 Paying heavy carry fees into cooling on-chain DEX trading volume. |
| Staking Yield Seekers vs Supply Inflation Dynamics | Diluting long-term holders through inflation-heavy reward structures. |
| 🏢 Institutional Allocators vs Speculative Derivatives | Hesitating to buy spot while offshore perps drive price discovery. |
🚀 Breakout Confirmation vs Liquidation Cascade
If this tension between leverage costs and spot absorption remains unresolved, upcoming technical breaches will determine short-term market structure. Price action remains pinned below primary overhead resistance while sitting above key support floors that define the current recovery attempt.
A sustained daily close above primary technical resistance, accompanied by expanding stablecoin market caps and accelerating decentralized exchange volume, would validate current leverage and clear a pathway toward the 200-day moving average. In this bullish scenario, high funding rates transition from a fragility risk into a temporary momentum cost.
Conversely, a rejection at resistance coupled with further contractions in protocol revenue could trigger a systematic unwinding of long positions. A breakdown below key support levels would turn expensive long exposure into aggressive market sell orders, compounding downside volatility.
The current positioning indicates that speculative leverage has overextended relative to organic on-chain yield metrics. If spot buying fails to accelerate, carry fatigue will eventually force leveraged market participants to reduce exposure.
Investors should monitor the relationship between offshore funding rates and DEX transaction velocity. A sharp fall in funding rates without a price collapse remains the healthiest path toward structural price discovery.
⚖️ Perpetual Funding Rate: A periodic fee exchanged between long and short traders in futures markets to ensure contract prices stay aligned with underlying spot valuations.
⛓️ Issuance-Backed Yield: Staking rewards generated via native protocol token inflation rather than actual transaction fees spent by network users.
- If funding rates remain elevated while spot price fails $80 resistance → position risk shifts into a high-probability long squeeze regime.
- If weekly DEX volume and stablecoin supply contract by over 5% → expect speculative leverage to unwind rapidly across altcoin derivatives.
- If protocol yield reliance on inflation issuance exceeds 90% amidst falling fees → long-term native token value capture deteriorates significantly.