Bitcoin Dominance Plunges Below Sixty: Stablecoin Surge Exposes Market Illusion

Decoding the Illusion: Why the Bitcoin Dominance Drop Signals Capital Flight, Not Altseason
A falling Bitcoin share of the market rarely signals an altcoin breakout when liquidity is actively drying up.

Market observers frequently misinterpret a declining Bitcoin market share as the undisputed precursor to broad-based speculative expansion. When Bitcoin dominance retraces from multi-month highs, retail sentiment reflexively anticipates capital rotation into higher-beta digital assets. However, structural on-chain analysis frequently reveals a far more defensive underlying reality.

The pattern suggests that aggregate capital is not migrating down the risk curve into speculative tokens at all. Instead, it is retreating into fiat-pegged instruments as macro volatility tightens liquidity conditions across the board.
📉 Unpacking the Microstructure Behind the Failed Breakout Attempt
Market metrics often behave like a hydraulic system where pressure relief in one sector simply reflects compression elsewhere. Bitcoin's market share recently touched an upper boundary before reversing sharply, breaking beneath a multi-month pivot level.

This rejection invalidated the initial breakout thesis almost as quickly as it formed. What appears on a surface-level scan as a loss of market leadership is actually a symptom of broader valuation compression across digital assets.
As absolute valuations compress, Bitcoin's relative share naturally contracts. Yet, this contraction fails to benefit alternative tokens because liquidity is exiting the ecosystem entirely.
"A falling tide lowers all assets, regardless of their narrative appeal."
💧 The Stablecoin Concentration Paradox and Liquidity Drains
To understand modern crypto market dynamics, one must observe how stablecoin supply interacts with exchange reserves during periods of stress. Tether dominance climbed significantly toward key overhead resistance, signaling that market participants are aggressively parking capital in cash equivalents.

Simultaneously, aggregate stablecoin supply experienced a substantial contraction of roughly $14.2 billion over a compressed thirty-day window, marking the sharpest outflow since mid-2022. This simultaneous expansion of stablecoin market share alongside a shrinking absolute supply reveals an uncomfortable truth. Capital is not merely rotating into stable parking spots; a vast portion is being redeemed and leaving the crypto rails altogether.
The Altcoin Season Index continues to print subdued readings far below the historical threshold required for a sustained speculative expansion. Strip away the noise, and the data points to capital preservation rather than risk accumulation.
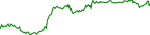
"Static cash is a defensive weapon masquerading as dry powder."
🔮 Navigating the Dual Thresholds of Market Direction
Evaluating upcoming market phases requires monitoring specific structural thresholds rather than reacting to emotional price swings. The interaction between Bitcoin's market share floor and stablecoin dominance resistance will dictate the immediate trading regime.

If stablecoin dominance successfully breaches its primary overhead resistance while Bitcoin's share drifts toward the lower boundary of its multi-month channel, the broader market will likely enter a prolonged risk-off consolidation phase. Conversely, a decisive rejection of stablecoin dominance at resistance would provide the first authentic technical confirmation of capital re-entering high-beta alternatives.
Professional market participants must therefore resist the urge to front-run a speculative season that lacks the underlying liquidity architecture to support it. Patience remains the ultimate hedge when indicators flash conflicting signals.
True sector rotation requires expanding aggregate liquidity, not a shrinking pool of capital shifting into defensive wrappers. Failing to distinguish between capital flight and asset rotation guarantees exposure to severe downside tracking errors. Monitoring stablecoin supply velocity alongside dominance metrics remains the definitive edge for modern allocators.
⚖️ Market Dominance: The percentage of total crypto market capitalization held by a specific asset, serving as a gauge for capital concentration.
🔄 Capital Rotation: The movement of funds from one asset class or token category to another in search of superior yield or relative strength.
- If stablecoin dominance closes above multi-month resistance → this signals an accelerated defensive transition across risk portfolios.
- If aggregate stablecoin supply contracts for consecutive 30-day windows → risk models must adjust for systemic liquidity withdrawal.
- If Bitcoin dominance breaches key structural channel support without altcoin volume expansion → capital preservation protocols activate.
— — coin24.news Editorial
This analysis is synthesized from aggregated market data and institutional research insights. It is provided for informational purposes only and should not be construed as financial advice. Cryptocurrency investments carry high risk; please conduct your own due diligence before making any investment decisions.
Related Intelligence

2027 Debt Crisis Tests Bitcoin Supply: Fissures in Fiat Leverage

Wells Fargo Clients Drive Bitcoin ETF: The Client Custody Pivot

Bitcoin Buyers Absorb 66k BTC Drop: The $74k Inflection Point

Nvidia Earnings Beat Masks Stock Drag: The Post-Huang Overhang

BlackRock ETF Rebound Masks Fragility: Institutional Trap at 64k