Phantom Purchasing Power: Why Exchange Stablecoin Inflows Signal Distribution Without Minting
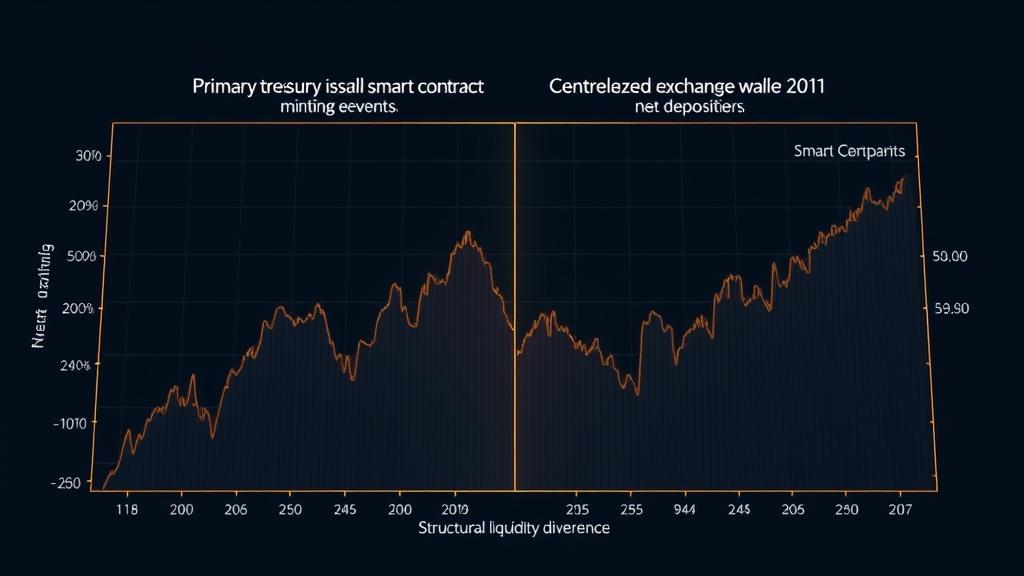
The Illusion of Exchange "Dry Powder" 🏦
A persistent thesis among digital asset market participants holds that rising exchange stablecoin balances represent idle buying power waiting to absorb supply and push spot prices higher. When on-chain metrics show substantial transfers of Tether (USDT) or Circle USD (USDC) into centralized exchange deposit wallets, retail commentary routinely interprets the event as "dry powder on the sidelines."
This interpretation rests on a basic premise: in traditional brokerage accounts, cash transfers precede equity accumulation. Therefore, stablecoins entering an exchange must represent fiat capital positioned to purchase volatile digital assets. This logic appears intuitive because it mirrors personal trading behavior.
However, this framework overlooks a structural distinction in digital asset market microstructure: stablecoins are tokenized liabilities, not central bank reserves. An influx of stablecoins into an exchange wallet does not, on its own, indicate that new fiat currency has entered the ecosystem.
Without verifying primary market issuance—net minting at the issuer treasury level—exchange stablecoin inflows often reflect internal asset reallocation, risk-off asset rotation, or market maker inventory balancing designed to facilitate spot distribution.
Primary Issuance vs. Secondary Reallocation ⚙️
To understand why exchange stablecoin inflows can coincide with local market tops and sell-offs, one must separate primary issuance from secondary reallocation.
Primary issuance occurs when an institutional entity wire-transfers fiat currency (USD) to an issuer's reserve bank account (e.g., Tether Limited or Circle Financial). Upon receipt, the issuer executes a smart contract transaction that mints new tokens directly into the primary buyer's treasury wallet. This process represents an exogenous expansion of total supply and increases aggregate market capitalization.
Secondary reallocation occurs when pre-existing stablecoins move between on-chain venues. These tokens may originate from self-custodial wallets, decentralized liquidity pools, yield protocols, over-the-counter (OTC) desk inventories, or derivative collateral accounts. Moving these existing tokens onto a centralized exchange changes their location, but not the total quantity of stablecoins in existence.
When exchange stablecoin reserves rise while total network issuance remains stagnant, the underlying liquidity dynamic is zero-sum. Rather than fresh fiat capital entering to buy spot assets, several alternative mechanisms are typically at work:
- Profit Taking and Downside Hedging: Market participants sell volatile spot assets (such as Bitcoin or Ethereum) on-chain or across secondary venues, receiving stablecoins in return. These stablecoins are then moved to exchanges to prepare for withdrawal or local yield deployment.
- Market Maker Inventory Rebalancing: Liquidity providers transfer stablecoin inventory to centralized venues to bid against large spot distribution orders from whales or institutions, providing liquidity while delta-hedging their exposure on futures markets.
- Derivative Collateralization: Stablecoins are deposited into derivative venues to serve as margin for short positions or complex options strategies during periods of institutional distribution.
When high exchange stablecoin inflows occur without net treasury minting, the movement indicates internal liquidity rotation or sell-side asset conversion rather than genuine fiat inflow.
Historical Parallel: The Eurodollar Mechanics 📜
This structural dynamic closely mirrors the expansion and reallocation mechanisms observed in the mid-20th-century Eurodollar market. Eurodollars—U.S. dollar-denominated deposits held in foreign commercial banks outside the jurisdiction of the Federal Reserve—operated as an offshore credit system distinct from primary central bank reserves.
During financial stress in the 1970s and late 2000s, spikes in offshore interbank dollar clearing volumes and cross-border balance transfers did not signify that the Federal Reserve was expanding the base money supply (M1/M2). Instead, these spikes reflected commercial banks and institutional investors rapidly moving clearing balances to settle outstanding debt obligations, satisfy margin calls, or post collateral for derivative contracts.
Analysts who interpreted high interbank dollar transfer velocity as a sign of expanding commercial credit frequently misjudged liquidity conditions. In reality, the high velocity of interbank transfers was a symptom of systemic dollar scarcity and defensive position adjustments.
In modern crypto markets, stablecoins function as private Eurodollars. Tracking stablecoin transfers between exchange wallets without verifying whether central treasuries are expanding leads to the same structural error: mistaking defensive inventory reallocations for net capital expansion.
The Accounting Mechanics of On-Chain Liquidity 📊
The distinction between genuine expansion and phantom purchasing power can be defined using a deterministic accounting identity. Aggregate market stablecoin supply ($S_{total}$) and centralized exchange stablecoin balance ($S_{exchange}$) are governed by separate flow vectors.
Let aggregate stablecoin supply be represented as:
S_total = S_minted - S_burned
Let exchange stablecoin reserve be represented as:

S_exchange = S_initial + Inflows_secondary - Outflows_secondary
We define the Net Issuance Ratio (NIR) over a given time interval ($\Delta t$) as:
NIR = Delta S_total / Delta S_exchange
Evaluating this ratio reveals three distinct market liquidity regimes:
| Regime Type | NIR Condition | Underlying Structural Mechanism | Market Implication |
|---|---|---|---|
| Net Capital Expansion | NIR >= 1.0 | Primary minting matches or exceeds exchange inflows. Fresh fiat is entering the primary market. | Structural buying power; genuine demand expansion. |
| Phantom Purchasing Power | NIR <= 0.0 | Exchange inflows spike while primary minting is flat or negative ($S_{total}$ contracts). | Capital rotation; spot asset liquidation into stablecoins; distribution setup. |
| Capital Flight / Redemptions | NIR < 0 and Delta S_exchange < 0 | Stablecoins are leaving exchanges and undergoing treasury burning/fiat redemption. | Net liquidity contraction across the ecosystem. |
Consider an illustrative simplified model of how asset distribution operates under an NIR of 0.0:
Suppose an institutional holder decides to liquidate 5,000 BTC ($250,000,000 equivalent value). The seller disposes of spot BTC through off-exchange OTC agreements or decentralized pools, receiving $250,000,000 in existing USDT from counterparty inventory. The seller then deposits this $250,000,000 USDT onto an exchange to execute cross-venue arbitrage or deploy to derivative short hedges.
On-chain monitoring tools record a massive deposit of $250,000,000 in USDT to the exchange wallet. Naïve indicators label this event as incoming buying power. In reality, the $250,000,000 USDT deposit is the direct mathematical consequence of $250,000,000 worth of spot Bitcoin distribution. The net fiat expansion in the crypto ecosystem throughout this transaction is exactly zero.
Empirical Verification Framework 🔍
To verify whether observed exchange stablecoin deposits represent real capital growth or phantom liquidity, analysts must cross-examine exchange wallet balance trends against primary smart contract events on issuing networks.
Using Stablecoin Flow Intelligence, analysts can track multi-chain treasury minting contracts alongside net exchange wallet flows to evaluate structural liquidity.
Key metrics to cross-examine include:
- Treasury Contract Events: Monitoring
IssueEventandRedeemEventfunction calls on major smart contracts (USDT on Ethereum/Tron, USDC on Ethereum/Solana) to measure changes in $S_{total}$. - Exchange Netflow Velocity: Tracking net 24-hour transfers into designated centralized exchange hot/cold wallet clusters.
- Spot vs. Derivative Exchange Allocation: Isolating stablecoin inflows directed specifically toward spot orderbook venues versus derivative clearinghouses.
A sharp increase in exchange netflows coupled with flat or declining treasury contract minting indicates that incoming stablecoins are the byproduct of recent asset sales, not a source of impending spot demand.
Strategic Frameworks for Market Analysts 🛡️
Rather than assuming that exchange stablecoin deposits are inherently bullish, market participants can evaluate on-chain liquidity using three specific analytical frameworks:
1. The Primary Minting Divergence Signal
Analysts can monitor the rolling 7-day correlation between aggregate stablecoin minting and net exchange stablecoin deposits. When exchange deposits reach statistical highs while 7-day net primary minting approaches zero, market participants should treat the price action as a potential distribution phase rather than an accumulation phase.
2. The Spot vs. Futures Margining Diagnostic
Track the destination of incoming exchange stablecoins. Inflows allocated to spot exchange wallets can support market pricing if paired with primary issuance. Conversely, stablecoins routed directly to derivative venues during periods of flat primary issuance often indicate that institutions are posting margin to open short hedges or leveraged positioning to absorb retail bids.
3. Chain-Specific Capital Velocity Protocol
Analyze the primary blockchain used for stablecoin deposits. Low-cost, high-velocity networks (such as Tron or Solana) frequently facilitate frequent inter-venue arbitrage, retail capital rotation, and payment settlements. Primary institutional minting and large fiat onboarding transfers historically concentrate on major settlement networks (such as Ethereum ERC-20). Disconnects between high retail venue transfers and stagnant settlement contract minting point to local asset reallocation rather than macro market expansion.
Educational and analytical purposes only. This content does not constitute personalized financial, investment, tax, or legal advice.
Test This Mathematical Reality Yourself
Do not rely on sentiment or emotion. Run your numbers through the Stablecoin Flow Intelligence to verify your exact risk threshold.
Launch Stablecoin Flow Intelligence →