XRP Liquidations Fuel 9 Percent Drop: ETF Assets Break $1B Floor

XRP Liquidations Trigger 9% Drop as Spot ETF Assets Break $1 Billion Floor
XRP just wiped out $18 million in leveraged bets while its spot ETFs lost their $1 billion crown.


The payments-focused token slid roughly 9% over 24 hours to trade near $0.87, extending its weekly decline to 11.5% and marking its lowest level since November 2024. This downturn is not an isolated asset failure, as Bitcoin fell roughly 9.4%, Ethereum dropped over 10%, and Solana shed more than 9% in a synchronized market retreat.
Examining the derivatives tape reveals the mechanics behind this rapid repricing. Roughly 94% of the forced closures hit long positions, punishing traders who attempted to front-run a recovery. With futures open interest sitting near $1.77 billion and 24-hour trading volume exceeding $3 billion, the market is experiencing a classic liquidity vacuum.
Meanwhile, US spot XRP ETFs recorded $4.97 million in net outflows on Friday, concentrated primarily in Bitwise's product. This pushed combined net assets across the five funds down to roughly $990 million, even though cumulative net inflows since launch still stand near $1.78 billion.
| Market Metric | Observed Value | Structural Signal |
|---|---|---|
| XRP Spot Price | ~$0.87 (-9% 24h / -11.5% 7d) | Breaks November 2024 support |
| 24h Liquidations | ~$18M (94% Longs) | 🟢 Severe bullish positioning flush |
| Futures Open Interest | 🌊 ~$1.77B (>$3B Volume) | High leverage density remains |
| Spot ETF Net Assets | ~$990M ($4.97M daily outflow) | 📉 Mark-to-market drop below $1B |
| Cumulative ETF Inflows | ~$1.78B | 🏛️ Core institutional base holding |
| Daily RSI | Below 30 | Oversold, but no reversal confirmation |
🌊 Liquidity Cycles and the Illusion of Institutional Flight
To understand why a single-day outflow triggered such an outsized psychological reaction, we have to zoom out to global liquidity cycles. When risk assets tighten simultaneously—evidenced by steep, synchronized drops across major Layer-1s and high-beta tokens like Hyperliquid's HYPE and Zcash—capital does not rotate; it retreats to cash.
In this environment, spot ETF asset totals act as a lagging mirror of underlying token prices rather than a real-time gauge of institutional conviction. Because net assets reflect the current market value of held tokens, a sharp spot sell-off automatically drags total assets under management below psychological milestones.

"Price depreciation shrinks the ETF pie far faster than investor redemptions ever could."
The uncomfortable truth is that retail and momentum traders frequently misread this accounting reality. They see a headline about a broken asset floor and assume institutional desks are heading for the exits, when the cumulative inflow data proves that the vast majority of original capital has not budged.
⚙️ Under the Hood: Liquidations, Funding Rates, and ETF Mechanics
If the ETF headline is largely a mark-to-market optical illusion, the derivatives market is where the actual structural damage is occurring. Let's break down how forced liquidations and negative funding rates interact when order books thin out.
In plain terms, leveraged futures contracts require traders to post collateral to keep their bets open. When the spot price drops rapidly, that collateral loses value, prompting exchanges to automatically sell the position into an already falling market. It is the financial equivalent of a downhill skier losing a binding mid-run—the momentum itself accelerates the crash.
Here is what everyone is ignoring: funding rates across major exchanges have flipped negative. This means short sellers are now paying long holders to keep their bearish bets open, a clear sign that aggressive downside speculation has replaced dip-buying.
What this signals structurally is a sharp divergence in stakeholder incentives. Short-term derivatives traders are exploiting thin weekend liquidity to press their advantage, while passive ETF allocators remain largely insulated from intraday margin calls. In my view, this creates a temporary dislocation where futures order flow dictates spot pricing, even though spot demand hasn't structurally collapsed.

📉 Market Impact and the Oversold Trap
Given this derivatives-driven pressure, the immediate technical picture looks bruised. XRP's daily Relative Strength Index (RSI) has dipped into oversold territory, a level that historically tempts contrarian traders to call a bottom.
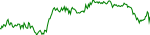
Strip away the noise, and an oversold RSI is merely a speedometer, not a brake pedal. It tells you how fast the market fell, not whether buyers are willing to step in front of the train. While oversold readings can precede sharp, short-lived relief bounces, they offer zero guarantee of a sustained trend reversal when broader crypto sentiment is deteriorating.
"Oversold is a condition, not a catalyst."
Short-term volatility will likely remain elevated as long as open interest stays bloated relative to spot liquidity. Over the medium term, however, flushing out over-leveraged longs is a necessary precondition for any healthy market base to form.
🔮 Navigating the Post-Flush Regime
Looking ahead, the trajectory for XRP hinges on whether spot buyers return once the derivatives overhang clears. If broader macro liquidity stabilizes and Bitcoin finds a floor, the lingering gap between cumulative ETF inflows and current net assets suggests there is a sticky base of institutional capital waiting out the storm.
Conversely, if negative funding rates persist alongside continued daily ETF outflows, the narrative could shift from a routine leverage flush to genuine institutional distribution. Investors should watch whether spot volume begins to outpace derivatives volume—a classic sign that real accumulation is replacing speculative noise.

The current market dynamics suggest that derivatives-led sell-offs often overshoot fundamental value in the short term. The divergence between sticky cumulative ETF inflows and shrinking mark-to-market assets highlights a temporary pricing dislocation rather than a structural exit.
Until funding rates normalize and open interest resets to healthier levels, expect choppy, range-bound price action. Sustainable recoveries are built on spot accumulation, not oversold technical indicators.
📉 Negative Funding Rate: A market condition in perpetual futures where short sellers pay long holders, signaling that bearish sentiment dominates derivatives positioning.
⚖️ Cumulative Inflows vs. Net Assets: Cumulative inflows track total net capital contributed by investors over time, whereas net assets fluctuate daily based on the market value of the underlying holdings.
📊 Relative Strength Index (RSI): A momentum oscillator measuring the speed and magnitude of recent price changes; readings below 30 indicate oversold conditions.
- If daily spot ETF outflows accelerate past $20M for three consecutive sessions → institutional distribution replaces passive holding.
- If futures funding rates remain negative while open interest rises → short sellers are pressing an overcrowded trade.
- If spot trading volume overtakes derivatives volume during a price stabilization → genuine organic accumulation is underway.
— coin24.news Editorial
This analysis is synthesized from aggregated market data and institutional research insights. It is provided for informational purposes only and should not be construed as financial advice. Cryptocurrency investments carry high risk; please conduct your own due diligence before making any investment decisions.
Related Intelligence

ARK Invest Buys $90M in Anthropic Shares While Trimming Ethereum ETF Holdings

Bitcoin Collateral Risk Shifts to Sui: Liquidity Illusion - Yield Trap?
Bitcoin Faces 75 Percent Crash Risk: Cycle Math Points To $31.5k

Pulsar Taps TRON 94B USDT Liquidity: The 24B Daily Rail Shift

Fidelity Custody Moves 7000 Bitcoin: Silent Custody Realignment